Chapter 9 Reliability Module
9.1 Classical Single-Test Reliability Analysis
An example from Field (2018 pp. 795-796):
“I have noticed that a lot of students become very stressed about SPSS Statistics. Imagine that I wanted to design a questionnaire to measure a trait that I termed ‘SPSS anxiety’. I devised a questionnaire to measure various aspects of students’ anxiety towards learning SPSS, the SAQ. I generated questions based on interviews with anxious and non-anxious students and came up with 23 possible questions to include. Each question was a statement followed by a five-point Likert scale: ‘strongly disagree’, ‘disagree’, ‘neither agree nor disagree’, ‘agree’ and ‘strongly agree’ (SD, D, N, A and SA, respectively). What’s more, I wanted to know whether anxiety about SPSS could be broken down into specific forms of anxiety. In other words, what latent variables contribute to anxiety about SPSS? With a little help from a few lecturer friends I collected 2571 completed questionnaires.”
Note: Only questions 1, 4, 5, 6, 7, 8, and 10 have been used to simplify the analysis.
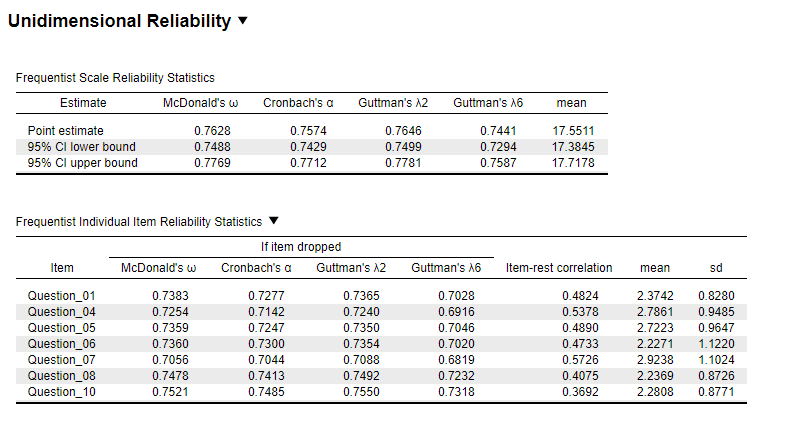
9.1.1 Results Overview
| JASP | SPSS | SAS | Minitab | R | |
|---|---|---|---|---|---|
| Cronbachs \(\alpha\) | 0.7574 | 0.758 | 0.7574 | 0.7574 | 0.7574 |
9.1.3 SPSS
DATASET ACTIVATE DataSet1.
RELIABILITY
  /VARIABLES=Question_01 Question_04 Question_05 Question_06 Question_07 Question_08 Question_10
  /SCALE('ALL VARIABLES') ALL
  /MODEL=ALPHA
  /STATISTICS=DESCRIPTIVE SCALE
  /SUMMARY=TOTAL MEANS.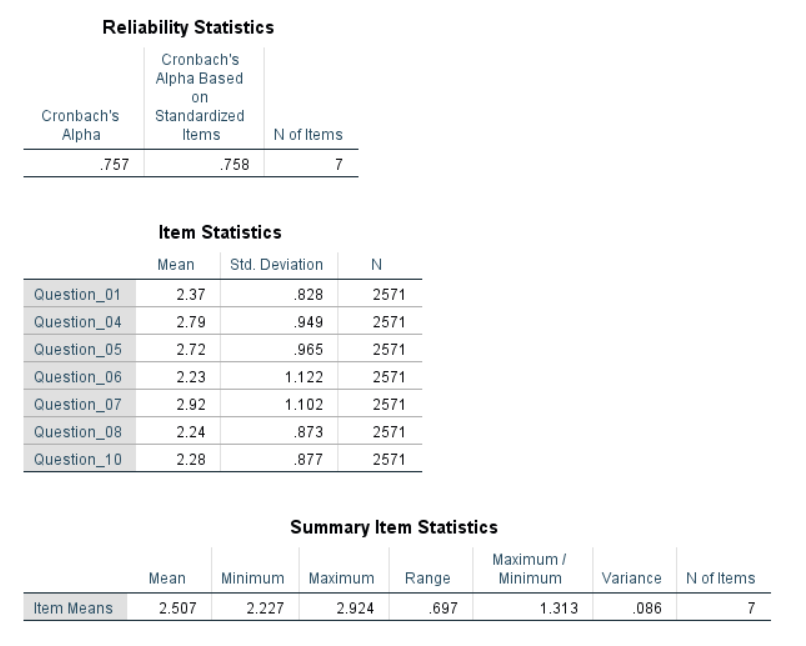
Figure 9.2: SPSS Output for Reliability Analysis
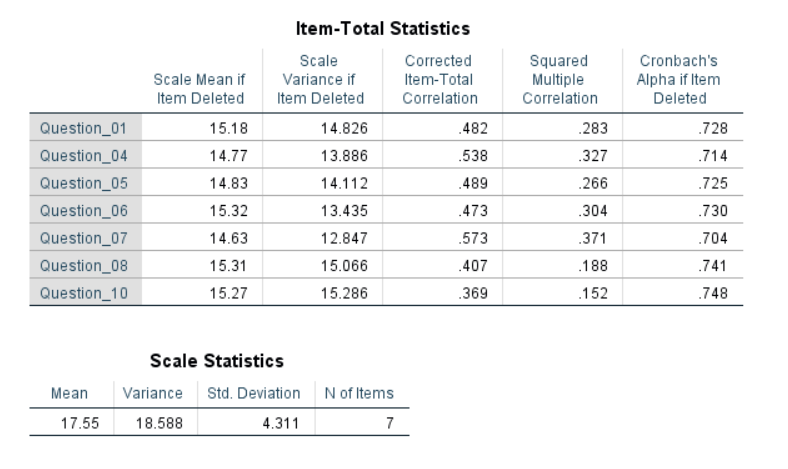
Figure 9.3: SPSS Output for Reliability Analysis
9.1.5 Minitab
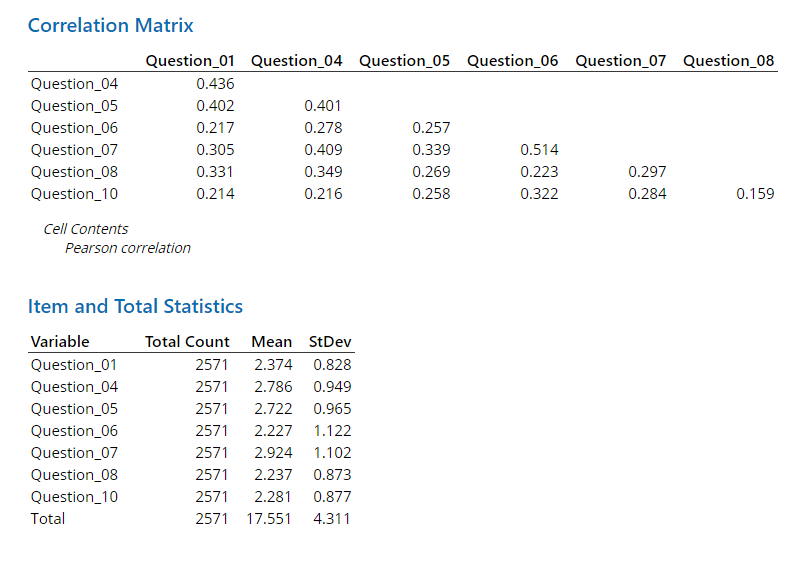
Figure 9.5: Minitab Output for Reliability Analysis
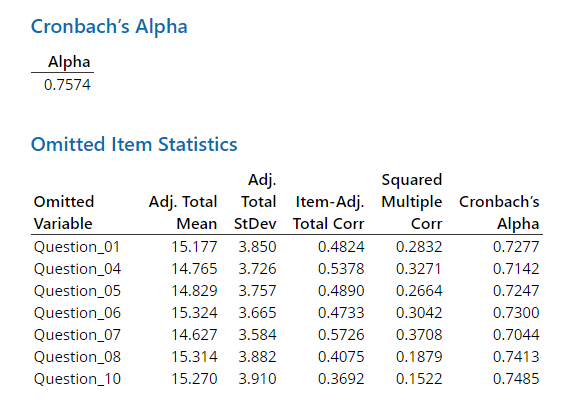
Figure 9.6: Minitab Output for Reliability Analysis
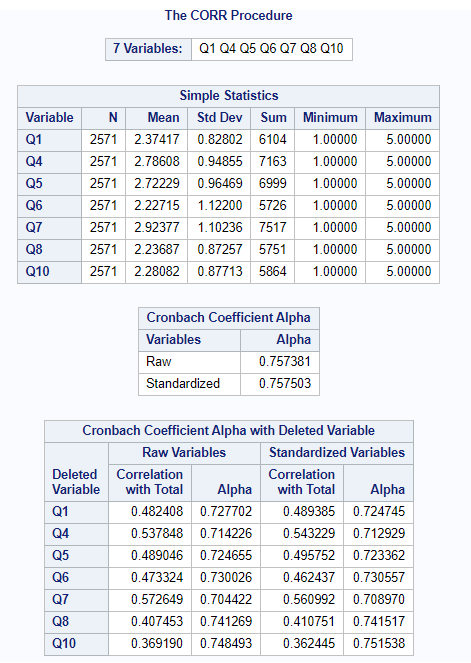
9.1.6 R
# library(psych)
QuestionSelection <- reli.data[c(1,4,5,6,7,8,10)]
analysis <- psych::alpha(QuestionSelection, cumulative = T)
analysis$total
## raw_alpha std.alpha G6(smc) average_r S/N ase mean sd
## 0.7573813 0.757503 0.7440687 0.3085574 3.123762 0.007201353 17.55115 4.311329
## median_r
## 0.297497## n raw.r std.r r.cor r.drop mean sd
## Question_01 2571 0.6228945 0.6501973 0.5677797 0.4824078 2.374173 0.8280221
## Question_04 2571 0.6848824 0.6913312 0.6268423 0.5378476 2.786075 0.9485482
## Question_05 2571 0.6498827 0.6551175 0.5691098 0.4890456 2.722287 0.9646904
## Question_06 2571 0.6626598 0.6292060 0.5488700 0.4733243 2.227149 1.1220023
## Question_07 2571 0.7317687 0.7046681 0.6536507 0.5726486 2.923765 1.1023600
## Question_08 2571 0.5692230 0.5881757 0.4711300 0.4074534 2.236873 0.8725704
## Question_10 2571 0.5382484 0.5488999 0.4163395 0.3691902 2.280825 0.8771293## raw_alpha std.alpha G6(smc) average_r S/N alpha se
## Question_01 0.7277017 0.7247454 0.7028417 0.3049925 2.633000 0.008153868
## Question_04 0.7142260 0.7129289 0.6916327 0.2927412 2.483457 0.008553717
## Question_05 0.7246553 0.7233622 0.7046391 0.3035270 2.614836 0.008232559
## Question_06 0.7300262 0.7305573 0.7020402 0.3112445 2.711364 0.008128863
## Question_07 0.7044218 0.7089704 0.6818863 0.2887689 2.436077 0.008995173
## Question_08 0.7412689 0.7415166 0.7232435 0.3234650 2.868721 0.007791848
## Question_10 0.7484933 0.7515384 0.7318020 0.3351629 3.024767 0.007620190
## var.r med.r
## Question_01 0.007856087 0.2837230
## Question_04 0.007391559 0.2837230
## Question_05 0.009125797 0.2974970
## Question_06 0.006534879 0.3053651
## Question_07 0.006679362 0.2686270
## Question_08 0.008291751 0.3053651
## Question_10 0.007077595 0.3307376## [1] 0.7573813