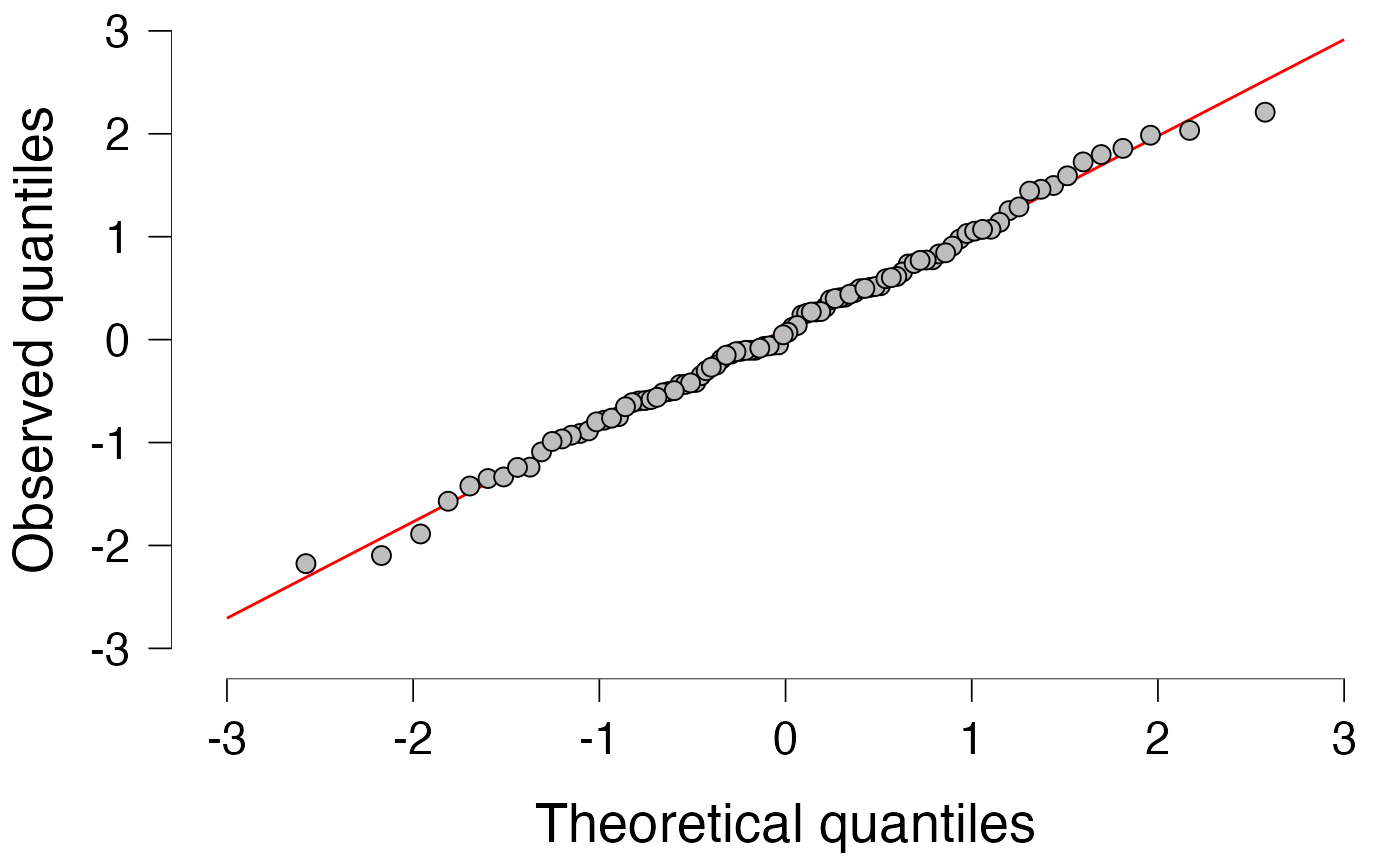
Make a Q-Q plot
plotQQnorm.RdMake a Q-Q plot
Arguments
- residuals
Numeric vector, the residuals of the analysis.
- lower
Numeric vector, lower confidence interval of each residual. If NULL, no error bars are drawn.
- upper
Numeric vector, lower confidence interval of each residual. If NULL, no error bars are drawn.
- abline
Logical, should an abline be drawn that best fits the points?
- ablineOrigin
Logical, should an abline be drawn through the origin?
- ablineColor
String, color of the abline.
- identicalAxes
Logical, should the axes have the same range?
- na.rm
Logical, should NA's be removed from residuals?
- xName
String, name for the x-axis.
- yName
String, name for the y-axis.
Details
This function is equivalent to qqnorm(residuals); qqline(residuals), but uses ggplot2 and allows for confidence bands.
Examples
x <- rnorm(100)
jaspGraphs::plotQQnorm(x)

# add a confidence interval for each point
lower <- x - .1
upper <- x + .1
jaspGraphs::plotQQnorm(x, lower, upper)
# add a confidence interval for each point
lower <- x - .1
upper <- x + .1
jaspGraphs::plotQQnorm(x, lower, upper)
