Histograms and Density plots for JASP
jaspHistogram.RdA plot histogram with three components.
(1) A histogram, which can be tweaks with the same settings as hist.
(2) A density line, which can optionally be shaded.
(3) rugs underneath the figure.
Each of these components can be enabled (or disabled) individually.
Colors are taken from graphOptions("palette").
jaspHistogram(
  x,
  xName,
  groupingVariable = NULL,
  groupingVariableName,
  histogram = TRUE,
  histogramPosition = "dodge",
  binWidthType = c("doane", "fd", "scott", "sturges", "manual"),
  numberOfBins = NA,
  rugs = FALSE,
  rugsColor = FALSE,
  density = FALSE,
  densityColor = FALSE,
  densityShade = FALSE,
  densityShadeAlpha = 0.6,
  densityLineWidth = 1,
  hideYAxisLabels = density
)
Arguments
- x,
numeric, the data to show a histogram for
- xName,
string, the title on the x-axis
- groupingVariable,
factor, show histograms and/ or densities for individual groups?
- groupingVariableName,
character, legend name of the grouping variable.
- histogram,
logical, should a histogram be shown?
- histogramPosition,
character, see argument
positioningeom_histogram.- binWidthType,
string, type of bindwidth, matches the string values that can be passed to
hist.- numberOfBins,
if binWidthType is set to "manual", this value determines the number of bins.
- rugs,
logical, should rugs be shown on the x-axis?
- rugsColor,
logical, should the rugs be colored?
- density,
logical, should a density be superimposed on the plot?
- densityColor,
logical, should the density be colored?
- densityShade,
logical, should the area underneath the density be shaded?
- densityShadeAlpha,
numeric in [0, 1], transparancy for the shaded density.
- densityLineWidth,
positive number, the line width of the superimposed density.
- hideYAxisLabels,
logical, should the y-axis line be hidden? Defaults to
showDensity.
Examples
set.seed(1234)
# some random data
x <- rnorm(1e3) + rnorm(1e3, 1, .1) - rgamma(1e3, 10, 5)
# individual plot components can be enabled or disabled
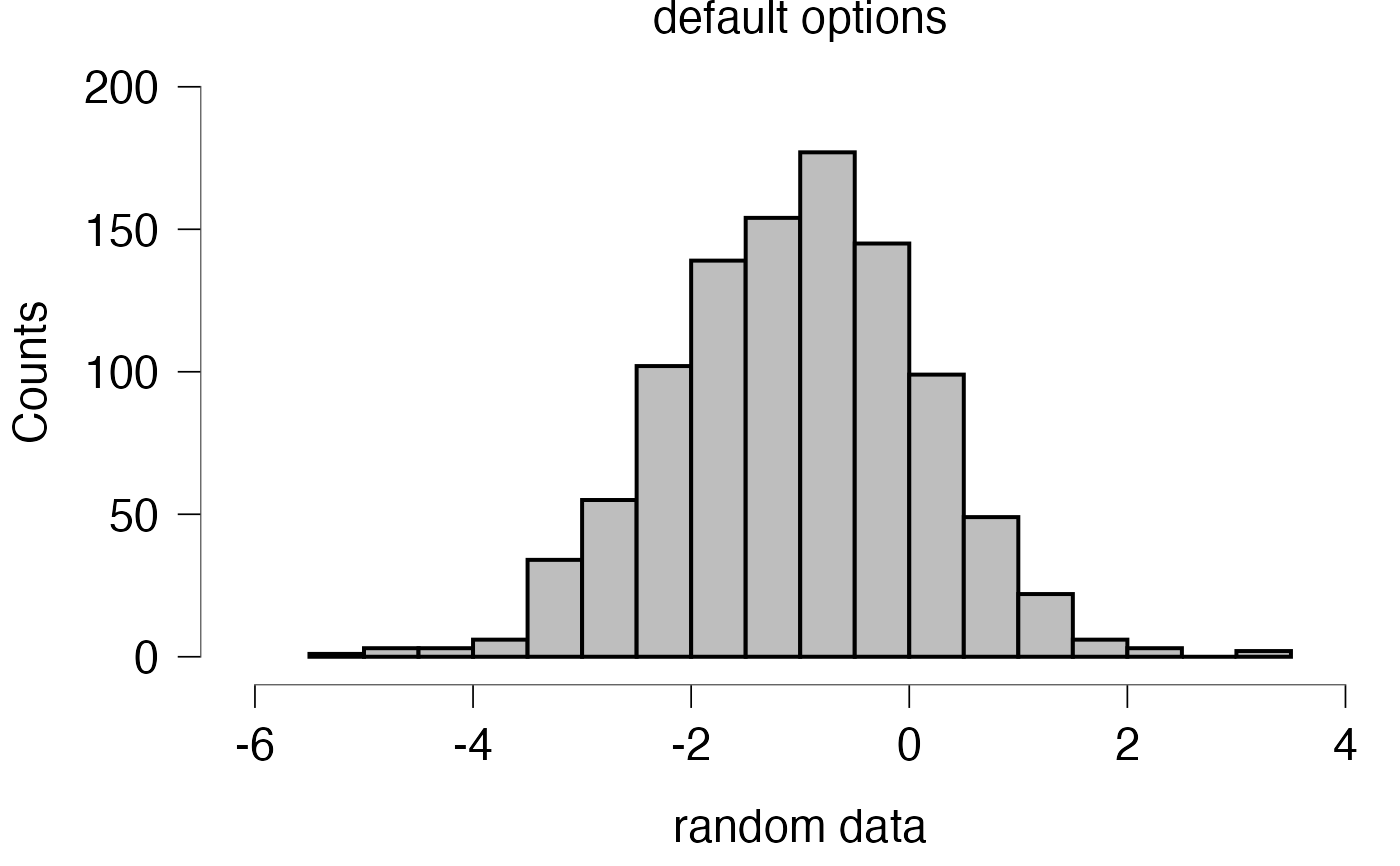
jaspHistogram(x, "random data", histogram = TRUE, density = FALSE, rugs = FALSE) +
ggplot2::ggtitle("default options")
#> Warning: The dot-dot notation (`..count..`) was deprecated in ggplot2 3.4.0.
#> ℹ Please use `after_stat(count)` instead.
#> ℹ The deprecated feature was likely used in the jaspGraphs package.
#> Please report the issue to the authors.
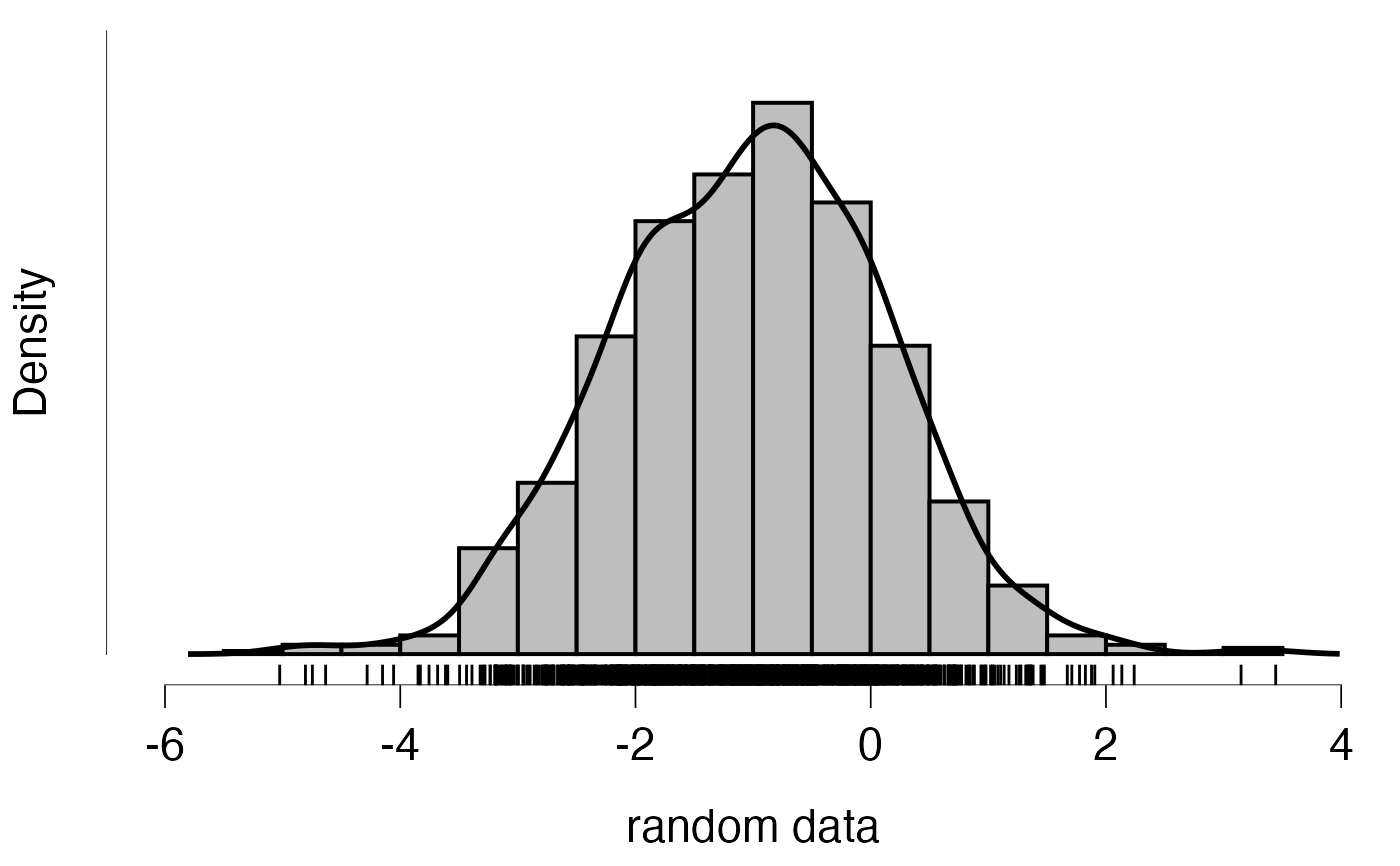
 jaspHistogram(x, "random data", histogram = TRUE, density = TRUE, rugs = FALSE)
#> Warning: Removed 12 rows containing missing values or values outside the scale range
#> (`geom_line()`).
jaspHistogram(x, "random data", histogram = TRUE, density = TRUE, rugs = FALSE)
#> Warning: Removed 12 rows containing missing values or values outside the scale range
#> (`geom_line()`).
 jaspHistogram(x, "random data", histogram = TRUE, density = TRUE, rugs = TRUE)
#> Warning: Removed 12 rows containing missing values or values outside the scale range
#> (`geom_line()`).
jaspHistogram(x, "random data", histogram = TRUE, density = TRUE, rugs = TRUE)
#> Warning: Removed 12 rows containing missing values or values outside the scale range
#> (`geom_line()`).
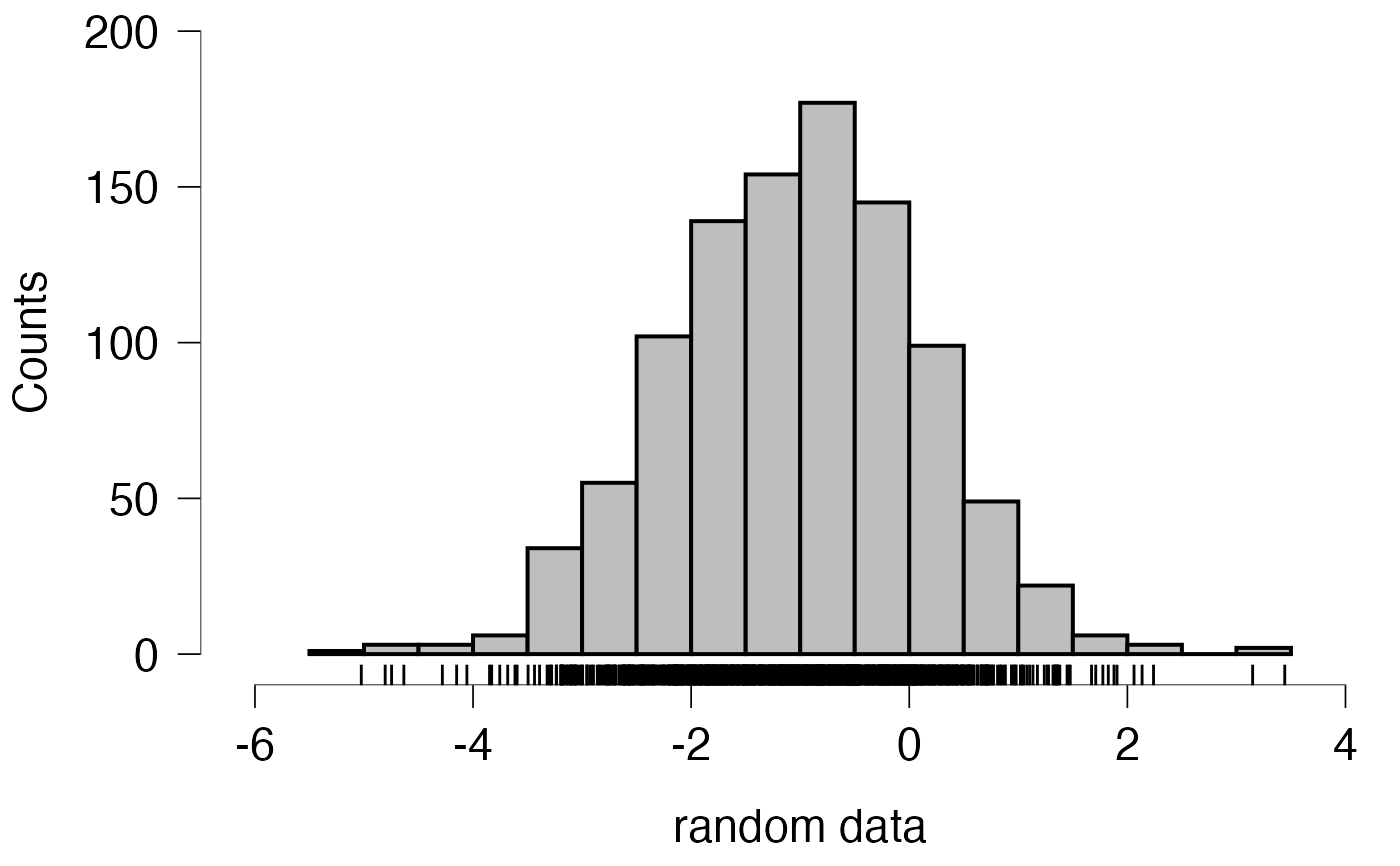
 jaspHistogram(x, "random data", histogram = TRUE, density = FALSE, rugs = TRUE)
 jaspHistogram(x, "random data", histogram = FALSE, density = FALSE, rugs = TRUE)
 jaspHistogram(x, "random data", histogram = FALSE, density = FALSE, rugs = FALSE) +
ggplot2::ggtitle("this is a bit boring though")
jaspHistogram(x, "random data", histogram = FALSE, density = FALSE, rugs = FALSE) +
ggplot2::ggtitle("this is a bit boring though")
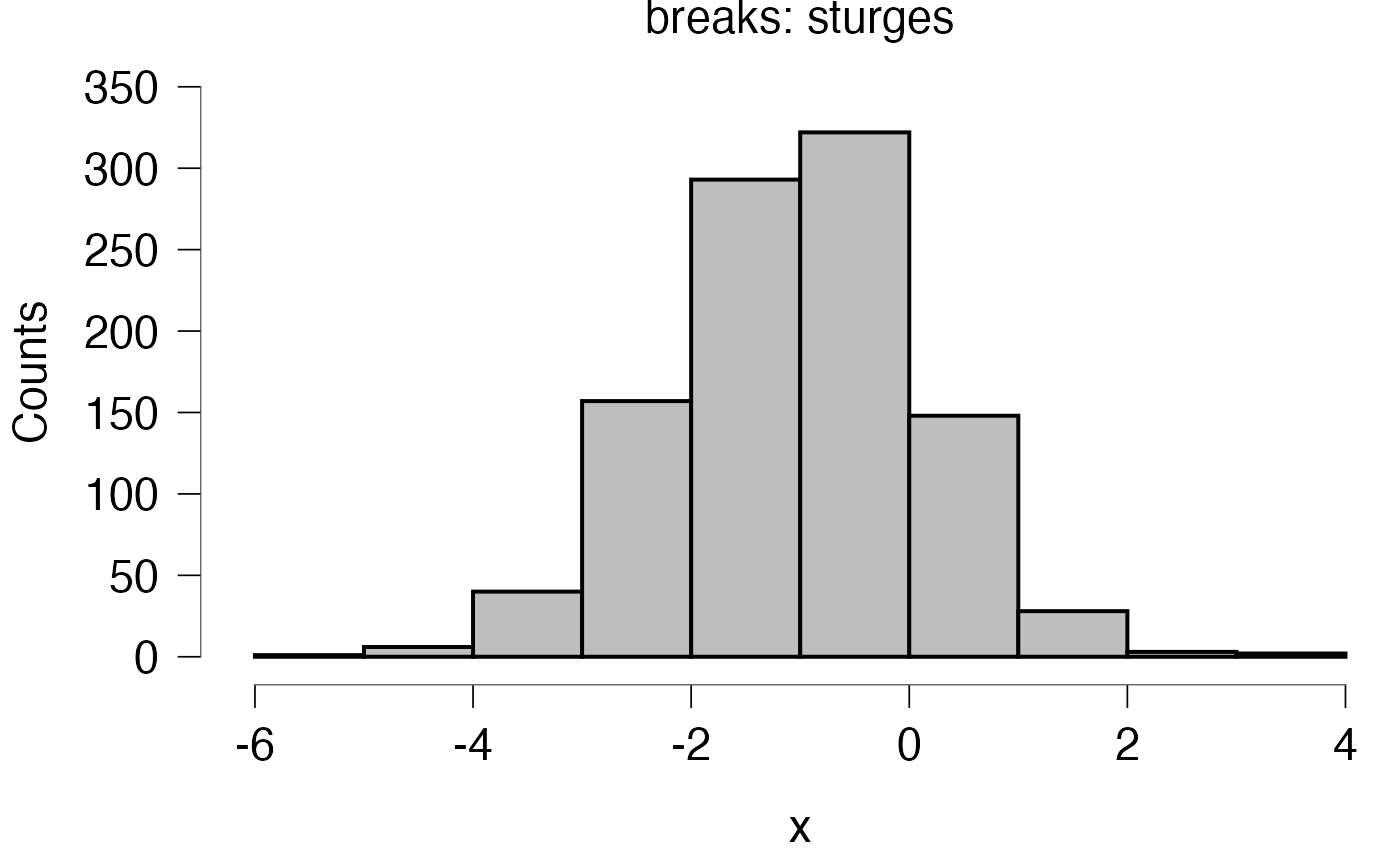
 # histogram style can be tweaked
jaspHistogram(x, binWidthType = "sturges") + ggplot2::ggtitle("breaks: sturges")
# histogram style can be tweaked
jaspHistogram(x, binWidthType = "sturges") + ggplot2::ggtitle("breaks: sturges")
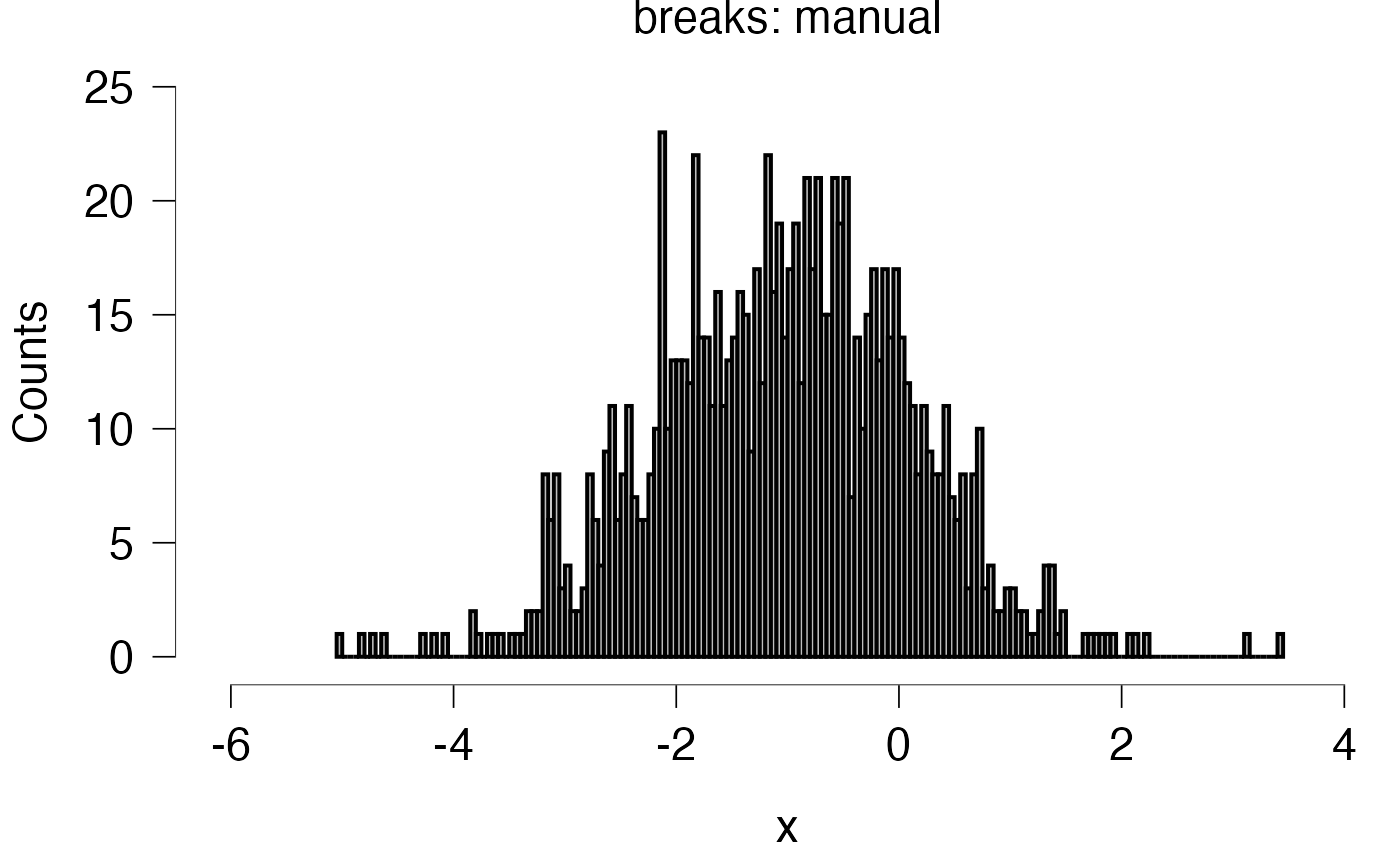
 jaspHistogram(x, binWidthType = "manual", numberOfBins = 250) +
ggplot2::ggtitle("breaks: manual")
jaspHistogram(x, binWidthType = "manual", numberOfBins = 250) +
ggplot2::ggtitle("breaks: manual")
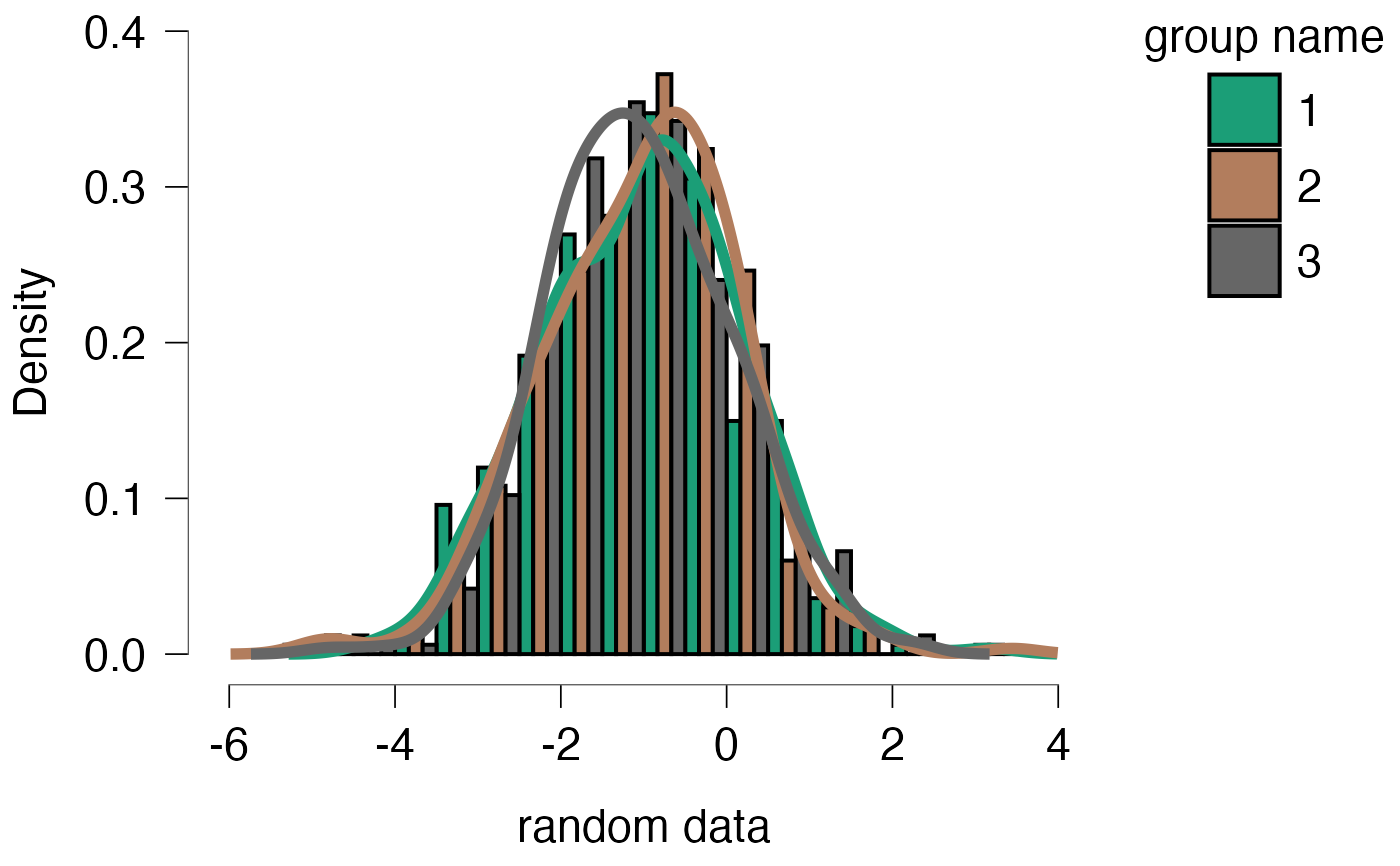
 # split by group
groupingVariable <- gl(3, 333, length = 1e3)
groupingVariableName <- "group name"
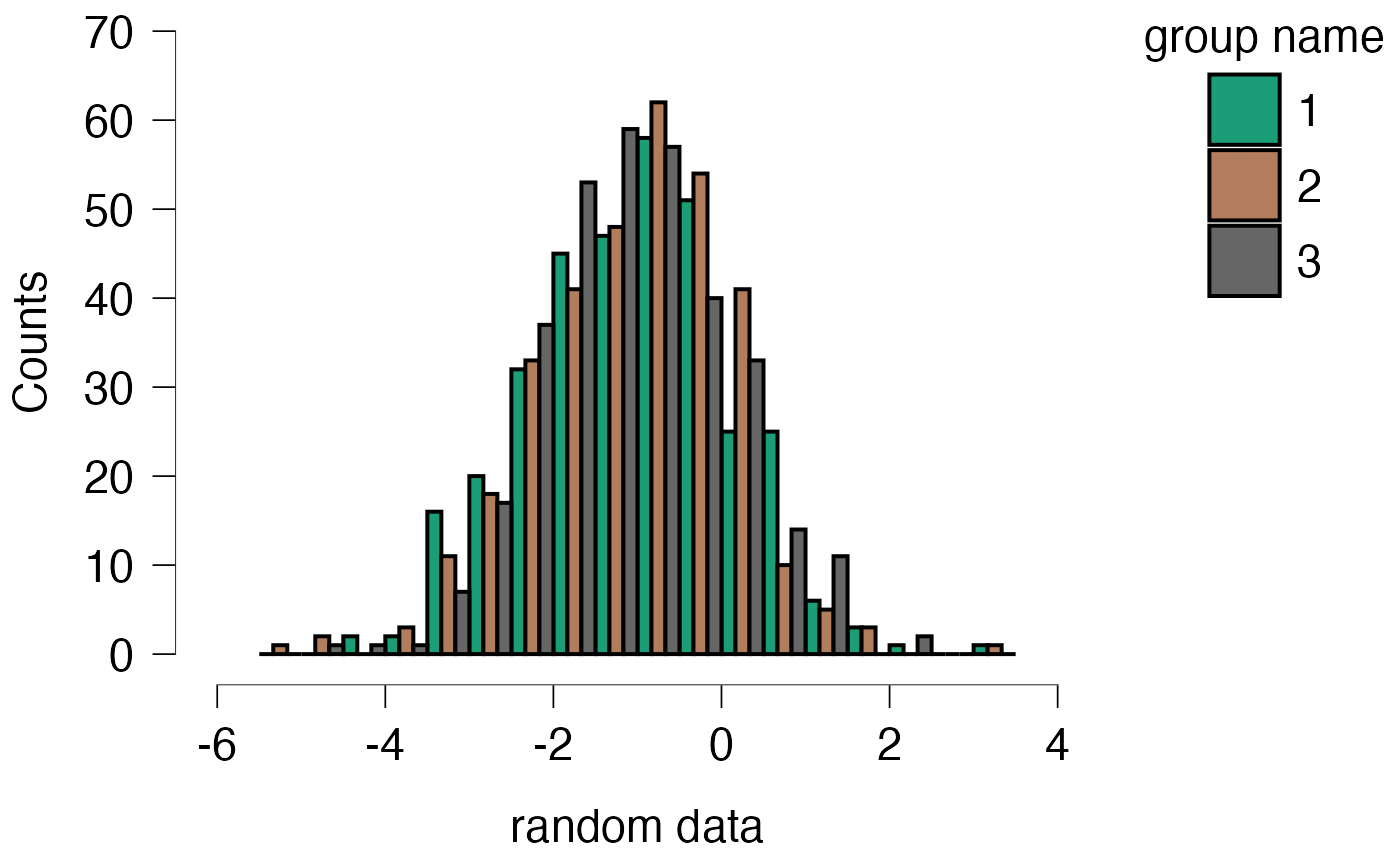
jaspHistogram(x, "random data", groupingVariable, groupingVariableName)
# split by group
groupingVariable <- gl(3, 333, length = 1e3)
groupingVariableName <- "group name"
jaspHistogram(x, "random data", groupingVariable, groupingVariableName)
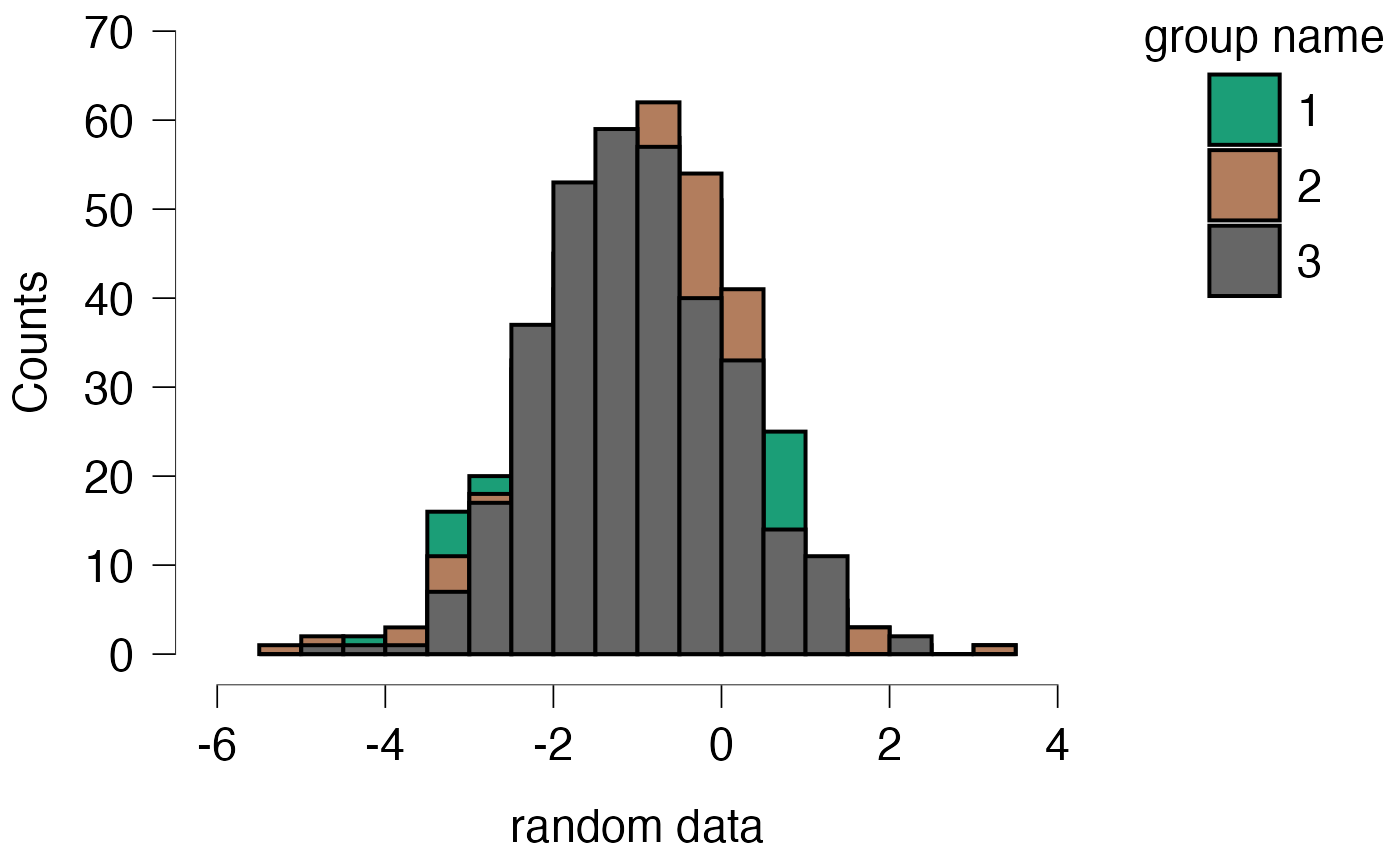
 jaspHistogram(x, "random data", groupingVariable, groupingVariableName,
histogramPosition = "identity") # stacked
jaspHistogram(x, "random data", groupingVariable, groupingVariableName,
histogramPosition = "identity") # stacked
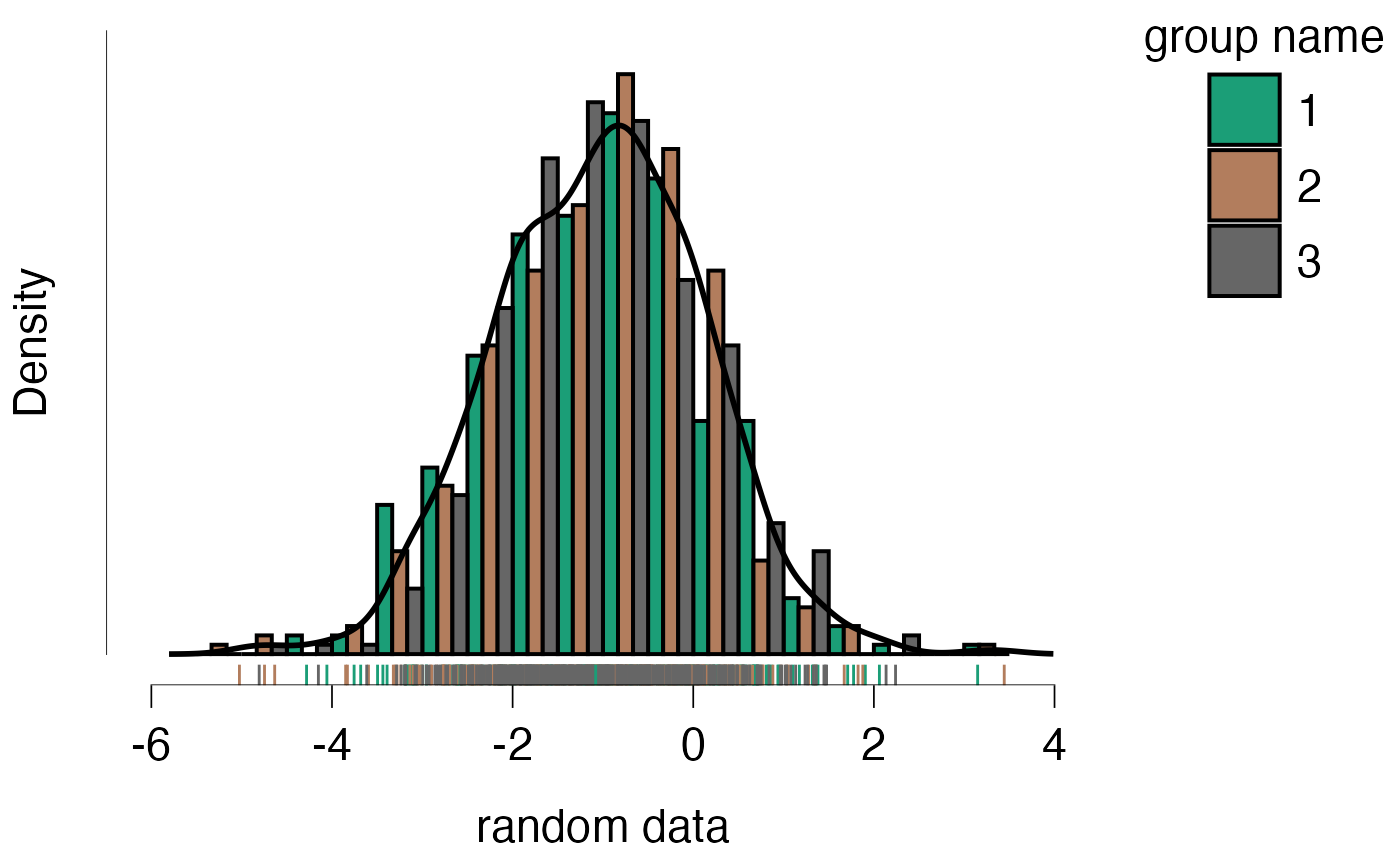
 jaspHistogram(x, "random data", groupingVariable, groupingVariableName, density = TRUE,
rugs = TRUE, rugsColor = TRUE)
#> Warning: Removed 12 rows containing missing values or values outside the scale range
#> (`geom_line()`).
jaspHistogram(x, "random data", groupingVariable, groupingVariableName, density = TRUE,
rugs = TRUE, rugsColor = TRUE)
#> Warning: Removed 12 rows containing missing values or values outside the scale range
#> (`geom_line()`).
 jaspHistogram(x, "random data", groupingVariable, groupingVariableName, density = TRUE,
rugs = TRUE, hideYAxisLabels = FALSE)
#> Warning: Removed 12 rows containing missing values or values outside the scale range
#> (`geom_line()`).
jaspHistogram(x, "random data", groupingVariable, groupingVariableName, density = TRUE,
rugs = TRUE, hideYAxisLabels = FALSE)
#> Warning: Removed 12 rows containing missing values or values outside the scale range
#> (`geom_line()`).
 jaspHistogram(x, "random data", groupingVariable, groupingVariableName, density = TRUE,
densityColor = TRUE, hideYAxisLabels = FALSE, densityLineWidth = 2)
#> Warning: Removed 31 rows containing missing values or values outside the scale range
#> (`geom_line()`).
jaspHistogram(x, "random data", groupingVariable, groupingVariableName, density = TRUE,
densityColor = TRUE, hideYAxisLabels = FALSE, densityLineWidth = 2)
#> Warning: Removed 31 rows containing missing values or values outside the scale range
#> (`geom_line()`).
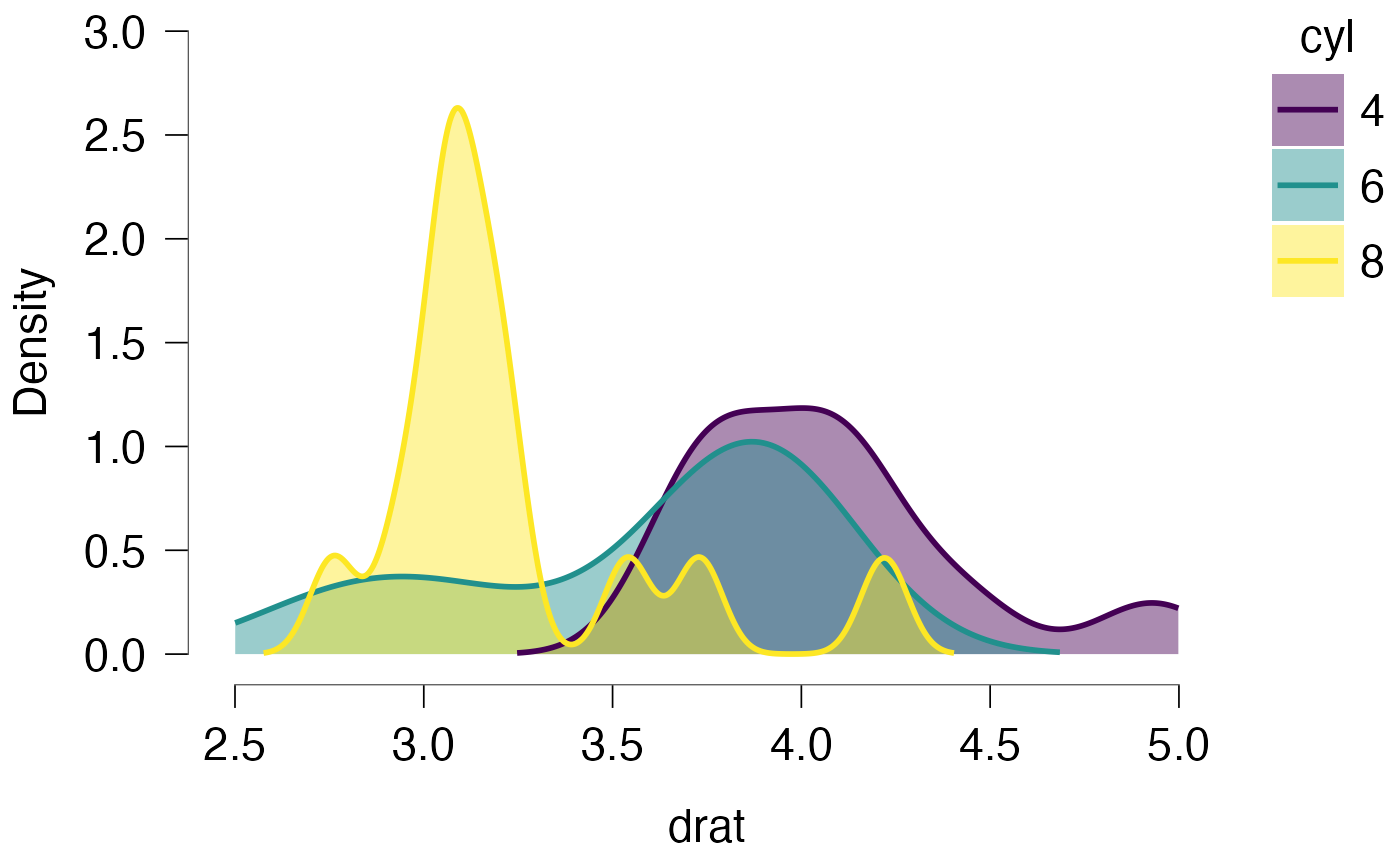
 # Can also be used to make fancy density plots
data("mtcars")
graphOptions(palette = "viridis")
jaspHistogram(mtcars$drat, "drat", factor(mtcars$cyl), "cyl",
histogram = FALSE, hideYAxisLabels = FALSE,
density = TRUE, densityColor = TRUE, densityShade = TRUE, densityShadeAlpha = 0.45
)
#> Warning: Removed 186 rows containing missing values or values outside the scale range
#> (`geom_line()`).
# Can also be used to make fancy density plots
data("mtcars")
graphOptions(palette = "viridis")
jaspHistogram(mtcars$drat, "drat", factor(mtcars$cyl), "cyl",
histogram = FALSE, hideYAxisLabels = FALSE,
density = TRUE, densityColor = TRUE, densityShade = TRUE, densityShadeAlpha = 0.45
)
#> Warning: Removed 186 rows containing missing values or values outside the scale range
#> (`geom_line()`).
 graphOptions(palette = "colorblind")